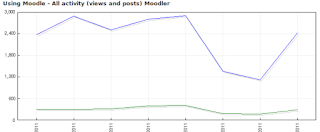
 This is a highly recommended Moodle to get the statistics option activated. If it's on your site will generate very nice and useful graphs and tables showing activity of users. The Report types you can generate are as follows...
- All activity
- Views
- Posts
To enable statistics you need to follow the next steps...
1. ‘Enable statistics’ under Site administration--Advanced features
2. After step 1 the link 'Statistics' will show under Site administration--Server
3. After clicking in the link 'Statistics' in the last step, another page will show up to set variables as Maximum processing interval, Maximum runtime, Days to process, Run at. (I didn't change anything here)
4. After the last steps, When I go to Site administration--Reports--Statistics and, in the select boxes, choose
Once the statistics are enabled, a manager, teacher or non-editing teacher will be able to see the graphs and tables for a course activity under the course layout in Reports > Statistics.
As an administrator, and this is my favorite part, you will be able to see the hole site activity under Settings > Site administration > Reports > Statistics
This is very useful for managers in the Educative organization, as can support decision making moments. As an example, if statistics is on you will be able to see how the Moodle user activity increase from year to year, in the case you Moodle stores information from several years.
With a quick search I found some other plugins that provide staticitis information as...
Overview statistics
Look at this link for more information on Analytics & Reports in Moodle
No comments:
Post a Comment